:: Spectrum Analyzer pro 4.6 UPDATE


:: New features to this program include

  • Leq (m) movie calculator (Long-Term Equivalent Level)
  • Leq (m) with weighting filters Leq dB(A),Leq dB(B) and Leq dB(C)
  • Leq time and frequency protocol for excel or as a text file
  • Average files converter to excel files (create your own Excel sheet)
  • Change RMS level Meter with Peak Meter
  • K-System (K-20, K-14, K-12) by Bob Katz
  • Level Meter norm > DIN45406
  • Level Meter norm > Nordic N9
  • Level Meter norm > BBC PPM
  • Level Meter norm > EBU PPM
  • Integration time from none up to 300ms
  • Referenz Level 0 dBFS and -18 dBFS and -20 dB
  • Note detector
  • dBFS and RMS Peak Level Meter
  • Weighting filters dB(A), dB(B) and dB(C)
  • 48000 hz audio stream
  • wide screen compatible
  • Correlation percentaged labels
  • 1/3, 1/6, 1/12, 1/24 Octave displaying of the Spectrum
  • Zoom function, where you can select 4 frequency ranges
  • resolution from 32768 fft so you have 1,46 Hz steps per each bar in the zoom function
  • Average function
  • Create a jpg from the actual displayed spectum
:: The Basic Module
  • Wave recording for the line in and the mic input
  • Mp3 player to analyze Mp3 files (Mp2, atx)
  • Two Peak Level Labels that give you control of the highest amplitude
  • Peak hold option
  • Generator leveling calibrated to 1/100 of a dB.
  • Mp3/Wave Tools like:
  • A Normalize function for wave files, Codec to convert Mp3 back to wave files,
  • Split Stereo Wave file into 2 Mono files, Swap left with the right channels
  • Spectrum +3dB for an overall improved monitoring of signals (less bass and more highs!)
:: Standard Features
  • A Visual Pause feature in the display for instantaneous evaluation of data
  • Direct comparisons with Function keys
  • Recording of the Critical Data with display of Amp, db, and frequency
  • Results can be saved in text files for further evaluation
  • 12 programmable frequencies for evaluation
  • Built-in generator monitors balance between input and output
  • Calibration of Input and Output to soundcard for correct line-in level recording
  • 3D Wavelet Transform Display in a scrolling-active feature
  • A precise Sync to loop feature with documented frequency analysis

:: The Print Module Print function for a frozen Spectrum with free eligibility labels, colors, and info text arrangements. You can create your own labels and save information about the measurements you record.

:: The Background Module You can load frozen spectrums into the Spectrum window. This is very useful if you like to make comparisons. Measuring them with the print module, you can print out your results!


  go to ShareIt

:: LEQ Calculator

leq (m) leq dBC, leq dBC

Leq (m) movie calculator. Choose between 1 minute up to 60 minutes. The Leq Calculator shows you the Leq max and the actual Leq (m) dB values. It shows you also the Leq from the 10 frequenies. You can create a CSV file to load it in Excel or save the whole protocol in a text file. Download the protocol leq_protocol.zip


:: Meter Balistic

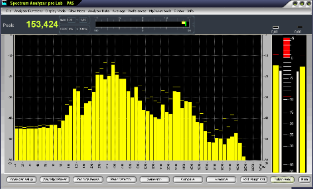
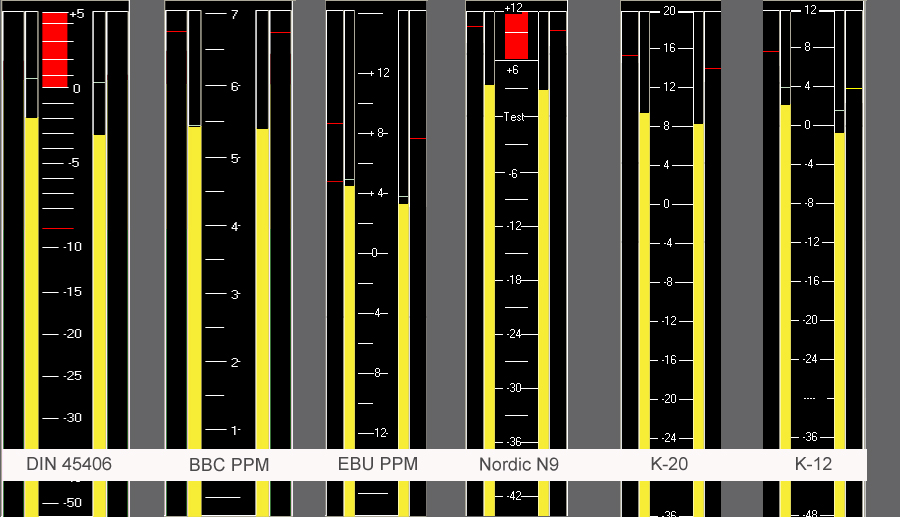
Spectrum Analyzer pro 4.5 can be configured in a number of different ways, to accurately model the ballistics, responses and graphics of a wide range of standard peak programme meters. These meters currently include the following:


DIN45406


EBU PPM


BBC PPM


Nordic N9


K-20


K-14


K-12


Integration time: Comparable with the attack time of a limiter. If “none“ is activated, this means that the present peak value is shown in the shortest and most precise way. If 5ms to 20ms is activated, the display is reduced to a mathematically calculated average value; the analysis of the display is now easier for the human eye. The effective peak values can be metered via the function ”Displays always dBFS“.

Reference level: 0 dBFS: Refers to the default adjustment. -18dBFS or + -20 dB: Television companies and audio post-productions work with this reference level. This means precisely:

-18 dBFS for the DIN 45406 norm = -9 dB

-18 dBFS for the Nordic norm = 0 dB / Test

-18 dBFS for the BBC norm = PPM 4

-18 dBFS for the EBU norm = 0dB / Test


:: Zoom function

The frequency ranges of all four Frequency Zooms are user-configurable.The numbered Frequency Zooms (1 - 4) store ranges for the frequency (X) axis of the analyzer plots that can be recalled with a single keystroke Crtl & F9- Crtl &F12. You can control the -3dB Values of the Bars.
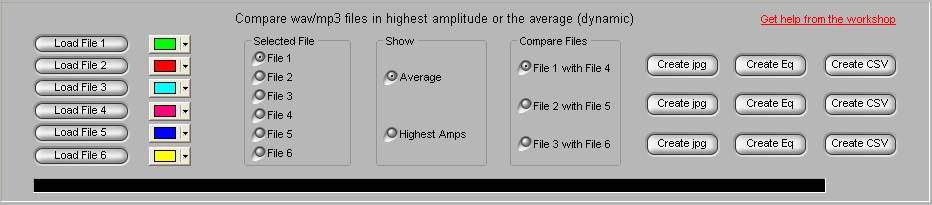
 

:: Average function

The Spectrum Analyzer can scan a wave or mp3 file, then calculate the average of all bars (amplitude) for the elapsed play time.

For example, if you have a 10 sec audio file, with a sampling rate of 44100 Hz, using an FFT of length 4096, there will be 901,120 different values. The program calculates the average value of each bar, then displays it. When the entire file has played, you will see the average off all bars over the entire time. In other words you can see the dynamics of the sound file.

It is also possible to compare results between files. You may load and compare up to 4 files using the Compare Files dialog box.
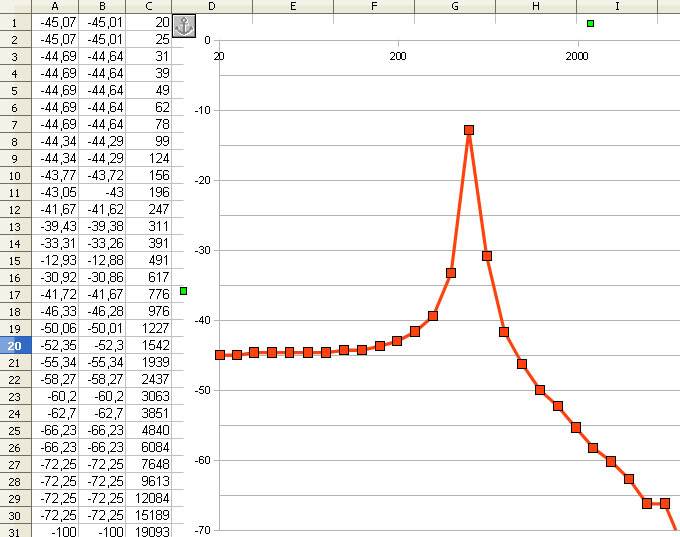
 

:: The Frequency dB module

You have the opportunity to program 12 frequencies with which to perform a more regulated analysis. It is possible to record the current dB values in a text file. All twelve frequencies can be programmed to any configuration you wish to evaluate.

:: The Generator module

The built-in generator allows the correct calibration between Analyzer and the line-in signal.


:: The Wave Player module

The Wave Player allows you the opportunity to load a pre-recorded Mp3/wav files and run an analysis of the data. All data contained in your sampling will be shown. Any changes made to the sampling rate will be automatically detected by the Spectrum Analyzer. The Locator is very practical when you work with big Wave files.


:: Calibrator

The Comparison Function is another invaluable instrument within your reach. The analyzer can display the input and output simultaneously in the Compare Window; or if you wish, it can display just the output. You can find the balance between input and output


:: Background module

You can load a frozen Spectrum as Background for better comparisons.Opportunity to select three various colors to make clear the difference amplitudes.


Demo download

Back Home to PAS-Products