
Measuring the linearity of loudspeakers or rooms
PAS-Products has unravelled the secret of measuring the linearity of loudspeakers or rooms.
Step by step we like to show you how you can check the linearity of your speaker system by using the Spectrum Analyzer pro Lab compare and the average function.
We start here:
And at the end we are here:
First the right sound card settings.
Sound card output
First set the volume for your amplifier to zero!
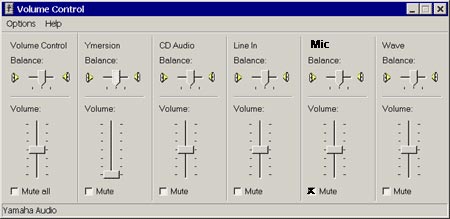
In the Playback Control mute the Mic option. We need the Mic just for the input and not for the output. Otherwise a feedback loop will occur that could damage your speakers. You can control the Generator out with the WAVE fader.
Sound card input
Select RECORDING.
recordmixer
Select MIC as input. On some soundcards you have the possibility to select the wave as input, please be shure that you don't select that checkbox, otherwise the signal from our output goes directly back in the input.
Calibration the input
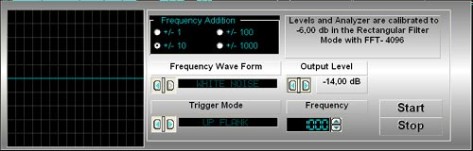
Open up the generator module. Select White Noise with -14,00 dB
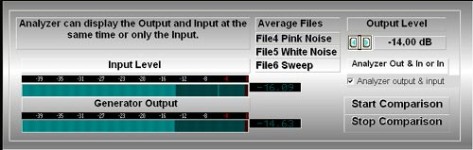
Than open up the compare module
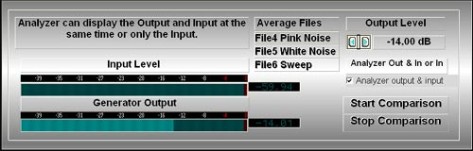
Set the volume from your amplifer to zero!!!
With "Start comparison" you can calibrate the input with the output. Press start comparison. Now you see the output level from the white noise in the Generator Output VU Meter. We have selected -14,00 dB.
Before you turn up the volume from your amplifier, talk into the Mic to see if you have routed the input correctly. Check the Input Level VU-Meter. If everything is OK, select the Analyser output & input checkbox so the Analyser only shows input. Now we see the input from our Mic in the VU-Meter and also in the Spectrum window.
Now slowly set the volume from the amplifier to the same as the out level. Please do this very slowly! You should now hear white noise from the generator.
The volume from the input don't have to be 100 % the same than the output level you have +- 10 % tolerance. OK, we have now the output level in our speaker and we have to calibrate the input. Click on "Stop Comparison"
Then press the "F2" key to run the program in the 1/3 Octave Mode. You only can get the EQ-Results in the 1/3 Octave mode.
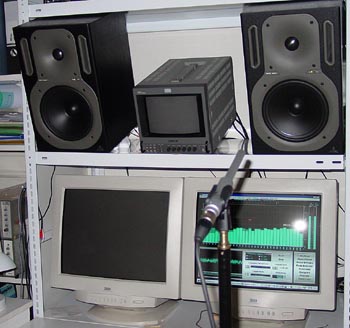
Now make 3 different checks to your speakers. Place the Mic approximately 1 metre from your speakers. The first test is with pink noise. Press "File4 Pink Noise". Now you should hear the Pink Noise signal for 5 seconds.
The program then automatically records the input from the Mic. After recording the input, the program scans the recorded file automatically for the highest Amplitude and calculates the Average Amplitudes. Then the program changes to the Average Module and loads the results into the File 4 section.
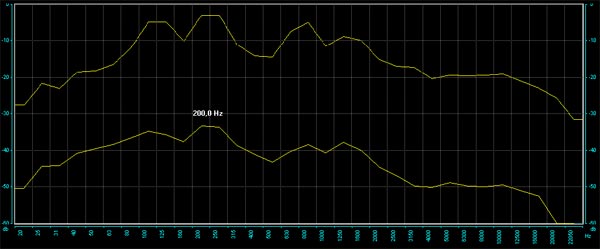
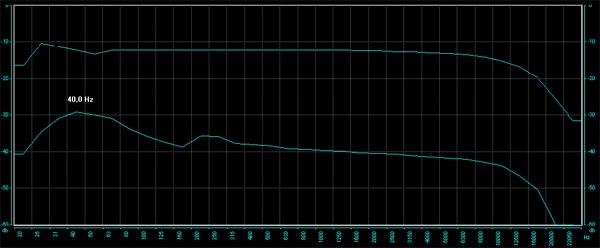
Click on the Selected File radio group File 4. You should see the curve from the Mic recordings. The higher line is the highest amplitude and the lower one is the average amplitude curve.
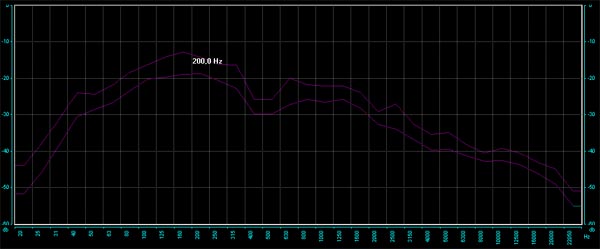
These are the results with Pink Noise. The Mic used was a Neumann KM 84 and the speakers were Yamaha NS-10M Studio monitors. Go back to the Compare Module and press the White Noise button.
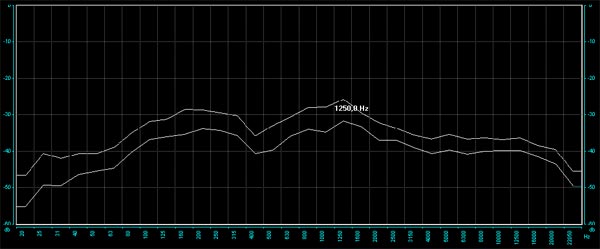
The results for white noise. And now the last test is with sweep - a tone from 20 Hz up to 20kHz. So go back to compare and press the "File 6 sweep" button.
The results for sweep tone.
Now we have to compare our scanned files with the originals to give us the best reference, so go to the Average module.
The recorded files are already loaded in files 4, 5 and 6. Click on the "Load File 1" button. A file dialog comes up and you should find the "pink noise.wav" file in the tones folder. Select it and the program will start to scan.
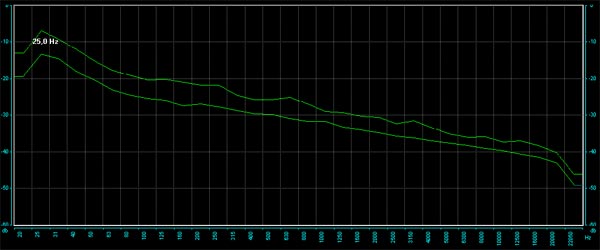
The first reference file is now scanned. It is pink noise, you see the highest Amplitude and the Average Amplitude.
Click on "Load File 2" and select the "white noise.wav" file. This starts the scan.
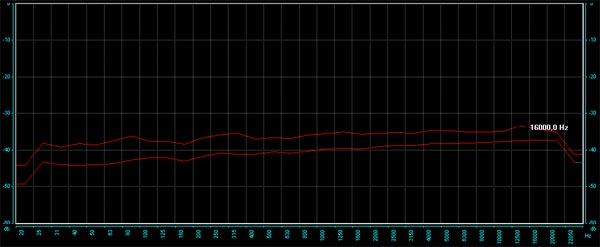
The secound reference file is now scanned. It is white noise, you see the highest Amplitude and the Average Amplitude.
Then press "Load file3" and select the "sweep.mp3" file.
And here the result of the reference tone with sweep.
Now we have all 3 reference files loaded and we can start the comparison. Click on the "Highest Amps" in the Show radio group. Then in the radio group click "Compare Files", and then click on the first one "File 1 with File 4". This is what you should see::
But first we must take a screen shot of the results. When doing this, take note that the screen shot colour from the reference file is always the first selected colour and the recorded file is the second selected colour. So we’ve worked with green for the first colour and red for the second colour.
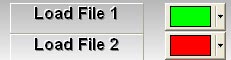
Click on "Create JPG" in the Average Module (not in the Analyser Module – the JPG button there will just create a single line). Save the file. So we now have the reference file in green and the recorded file in red.
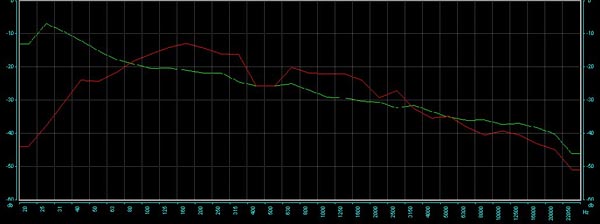
It shows the 100 reference line in green and the recorded Mic file in red (Pink noise measurement).
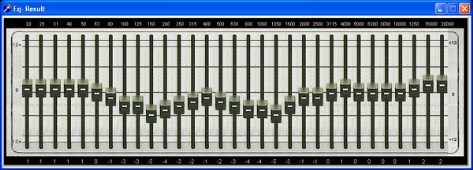
Now press the "Create Eq" button
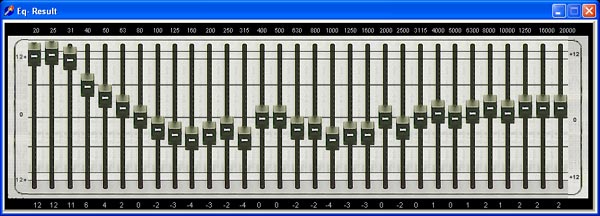
The program can create the correct Eq settings for your loudspeaker and your room. If you look at the frequencies from 20 Hz up to 63 Hz, you can see, that the Eq try to bost the missing levels in that section. The reason why the curves in that frequency range are so low, is that our speakers can't play so low frequencies. You can see that in the reference lines of the lodspeakers yamaha ns-10M down under this page. We recommend to ignore this frequency range.
But for the rest, you can compare it with the lines from our reference ton and the recorded mic file. Check the frequency range from 100 Hz to 400 Hz in our compare picture. You will see that there was a boost from our recorded mic file and exactly this section the Eq will bring down the frequencies with up to -4dB.
Now you understand how the compare picture and the Eq settings are working. When you now copy the setting from our Eq to your Hardware-EQ and do the test again, than you will see that the speaker in the room are linear and the Eq result will be for the hole frequency range 0 dB. But first we like to compare, the white noise lines.
Click "Compare Files" then "File 2 with File 5".
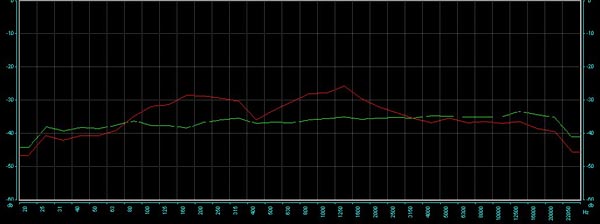
Here we have the white noise measurement. The green line is reference and the red is the Mic white noise file.
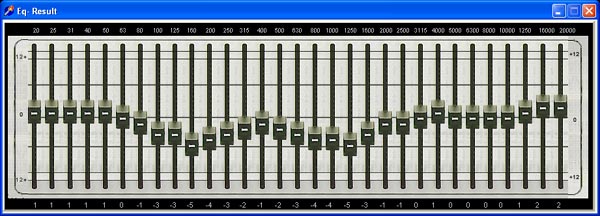
Here are the Eq-Setting for the white noise compare picture. You see that this Eq-Setting is a little bit differend than the one with pink noise. Why?
Here is the 1. reason:
This is the linear frequency line from our Neumann KM 84. You see that we lost in the frequency range from 20 Hz to 50 Hz around -10 dB.
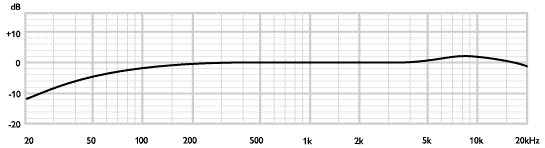
Here is the 2. reason:
This is the linear frequency line from our Yamaha NS10-M loudspeakers. You see that we lost in the frequency range from 20 Hz to 80 Hz around also -10 dB.
In the pink noise referrence ton, we have a boost of that frequency range and in the white noise we have a nearly linear frequency range.
PAS-Products recommed to use the white noise measurement to adjust speaker or rooms with not so low frequency requirements (sub woofer). The pink noise(and also sweep) is recommended for speakers and rooms with sub woofers and a low frequency requirements.